Background and Market Trends
The Trump administration has been changing how government data is collected and shared, raising concerns among economists, scientists, and policymakers about the integrity of official statistics. This issue came to the forefront when President Trump fired Erika McEntarfer, head of the Bureau of Labor Statistics (BLS), after the agency reported slowing job growth. While presidents often highlight favorable numbers, McEntarfer’s removal sparked alarm over potential politicization of data that has long been considered neutral and reliable. Critics, including members of Trump’s own party, argue that dismissing officials over data reporting undermines confidence in government statistics.
Beyond employment figures, the administration has scaled back or frozen several other streams of federal data. The National Weather Service reduced weather balloon launches, the National Climate Assessment lost funding and staff, and the CDC scrubbed certain HIV statistics from its website. Immigration and workforce datasets have also faced delays or long freezes. These changes have left researchers and the public with significant information gaps, impacting everything from climate forecasting to health decision-making. Experts warn that limiting or altering data could hurt public health and safety, since accurate numbers are essential for making good decisions.
The White House has denied accusations of data manipulation, insisting that the administration is committed to transparency and accuracy. Officials argue that staffing issues, outdated collection methods, and resource constraints explain the cutbacks, while President Trump himself has dismissed unfavorable figures as "rigged." At times, President Trump has contradicted his own agencies’ reports, choosing to amplify positive statistics when they support his narrative. Critics argue that this selective approach damages trust in government data and could weaken institutions that are supposed to provide unbiased, reliable information to the public.
Paul Schroeder, head of the Council of Professional Associations on Federal Statistics, warned that “stat agencies are under incredible pressure to get timely, accurate and granular data to the American public,” emphasizing that staff “are largely apolitical” and focused only on the integrity of the data.
At the same time, President Trump and his allies have accused BLS data of being politically skewed, despite experts saying such claims misunderstand how the agency works. Aaron Sojourner of the Upjohn Institute noted it is “a mistake to imagine that it’s anything other than technical experts doing their best with the resources they have.”
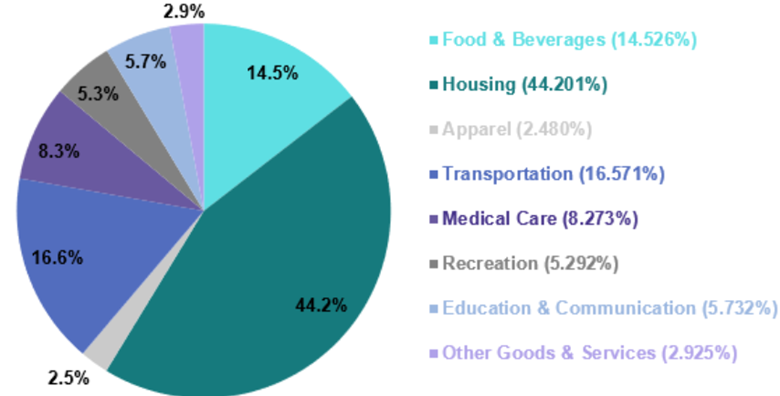
Other commentators highlighted that the BLS increasingly struggled to maintain standards. Data collection has been reduced in several cities, forcing the agency to rely more heavily on estimates and web scraping. By June 2025, 35% of Consumer Price Index (CPI) data points were imputed rather than directly observed, compared with just 10% at the start of the year.
Falling survey response rates since the pandemic have further increased errors and revisions in flagship reports. Meanwhile, the agency faces an 8% budget cut and the loss of more than 150 staff next year, raising concerns about growing delays and declining data quality.
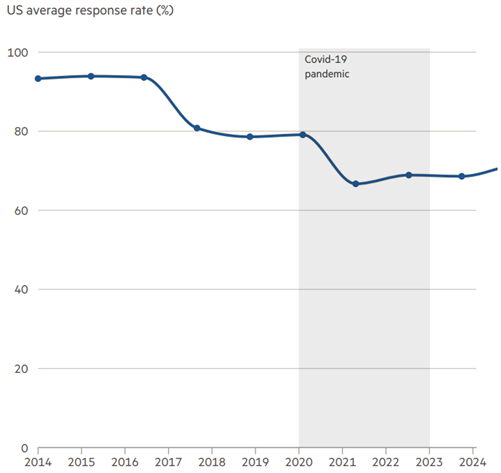
Similarly, the Current Employment Statistics (CES) survey, which tracks nonfarm employment, and the Job Openings and Labor Turnover Survey (JOLTS) have experienced notable drops in responses. This erosion in data collection undermines the precision of economic reports and raises concerns about the reliability of information used by policymakers, businesses, and households.
The challenge is particularly pressing for the monthly jobs report, which is released on the first Friday of every month with limited time to gather data. With fewer responses coming in from employers, the reports carry a higher margin of error, leading to larger and more frequent revisions. Economists warn that these revisions, such as those highlighted in the July 2025 report, are not evidence of manipulation but rather a reflection of the strain caused by low response rates and under-resourcing at the agency. As a result, the credibility of one of the world’s most closely watched economic indicators is increasingly at risk.
Former and current staff warn that the loss of experienced personnel has compounded the challenges. Many senior “guild masters” who once trained younger staff have opted to retire early, leaving critical expertise gaps. With funding now 18% lower in real terms than in 2009 and advisory committees eliminated, economists caution that the U.S.’s reputation for high-quality statistics is at risk.
Loss of confidence in government data would have major implications for financial markets, particularly the $2.1 trillion Treasury inflation-protected securities (TIPS) market, which relies directly on the CPI calculated by the BLS. “If there is politicization of the BLS, and somehow the data is not credible it poses an enormous risk over time to the TIPS market,” said Amar Reganti of Hartford Funds. Michael Feroli at JPMorgan added that even small changes in how inflation is calculated could make a big difference, noting that using European methods would lower U.S. inflation figures by about 0.2% a year.
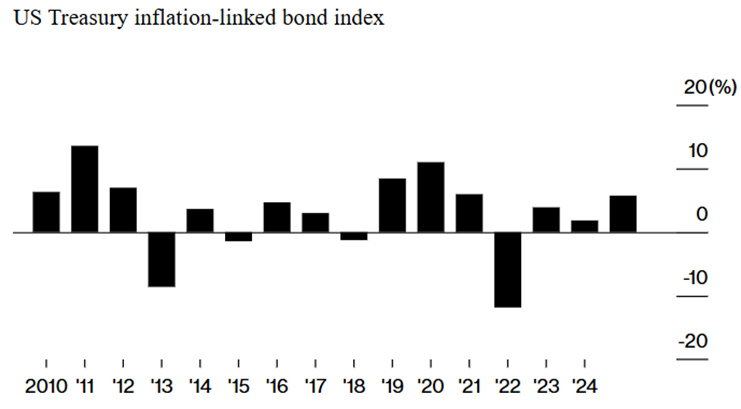
This concern comes at a time when inflation has been running above the Federal Reserve’s 2% target, and TIPS have been performing strongly. The Bloomberg index of inflation-protected Treasuries is up 5.7% in 2025, its best run since 2021. At the same time, slowing job growth has fueled bets on an interest rate cut, even as Trump’s tariffs add pressure to prices. With TIPS making up about 7% of U.S. government debt and Treasury planning to sell more of them, investors say maintaining trust in government data is critical. As Reganti put it, “An enormous amount of trust from the Treasury market has been installed in the secretary and the department. It would never give that type of leeway to a private sector issuer.”
Academic Research
Analysis of large datasets for economic monitoring can be traced back to business cycle studies conducted by Arthur Burns and Wesley Mitchell (1946). They embarked on the first comprehensive study of economic fluctuations, treating it as a big data challenge by examining numerous data series for patterns. Their groundbreaking work revealed consistent co-movements among these series, highlighting recurrent expansions and recessions as fundamental states within the economy.
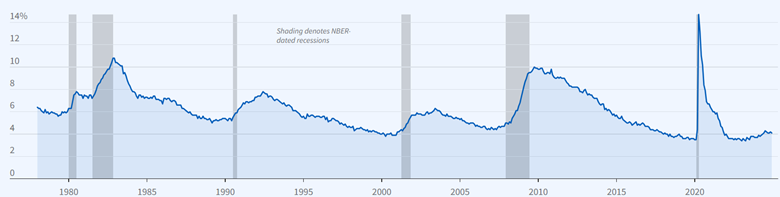
The business cycle dating carries on the legacy of Burns and Mitchell's work through the Nation Bureau of Economic Research (NBER) Business Cycle Dating Committee. This committee is responsible for officially identifying turning points in the US economy. Their analysis involves scrutinizing diverse economic measures like real GDP, real gross domestic income, employment, and industrial production, along with other indicators. Phases of expansion run from the month following a trough to the next peak and phases of recession run from the month following a peak to the next trough.
Expansions and contractions refer to the direction of change in economic activity and not its level. The NBER determines the peak as the month when a variety of economic indicators reach their highest level followed by a significant fall in economic activity. Similarly, a trough is determined when economic activity reaches a low point followed by sustained recovery. Figure 3 below shows that the most recent peak occurred in February 2020 and the most recent trough in April 2020.
Advancements in time-series econometrics in the past two decades have paved the way for modern-day nowcasting systems. Giannone et al. (2008) pioneered a statistical framework by merging big data models and filtering techniques. Their method was designed to manage large datasets with staggered release dates, mirroring the real-time flow of information.
Their approach not only enabled GDP nowcasting but also evaluated the impact of each new data release on the nowcast and its precision. Essentially, this framework acts as a comprehensive bridge model, incorporating a large array of data series, updating nowcasts in real-time, and linking monthly data releases to the quarterly GDP nowcast.
Banbura et al. (2010) defined nowcasting as “the prediction of the present, the very near future and the very recent past.” It isn't merely about early estimates but involves evaluating how new data impacts subsequent forecast revisions for the target variable. Researchers have developed a statistical model that generates a sequence of nowcasts aligned with real-time economic data releases.
A similar approach was used by Aastveit et al. (2014) when researchers created combined density nowcasts for quarterly GDP growth. Findings revealed that the accuracy, measured by the logarithmic score of predictive densities, consistently improved as new data arrived throughout the quarter. The combined density nowcasts consistently outperformed standard point forecast models.
Cepni et al. (2019) used macroeconomic diffusion indexes to nowcast GDP in emerging markets. They addressed the issue of missing data at the beginning of sample periods, especially prevalent in emerging markets. Various dimension-reduction, machine learning, and judgmental variable selection methods are utilized to construct timely short-term predictions of GDP growth for emerging markets.
Predictions based on dimension reduction, machine learning, and shrinkage methods proved effective for emerging economies, with the Bloomberg Relevance Index method and sparse principal component analysis performing well. These findings highlight spillover effects among emerging market economies and emphasize the significance of capturing such connections effectively when leveraging high-dimensional global datasets for GDP prediction.
Babii et al. (2021) introduced structured machine learning regressions tailored for high-dimensional time series data gathered at different sampling frequencies. They highlighted the efficacy of the sparse-group LASSO estimator in exploiting these data structures. In an empirical application nowcasting US GDP growth, the sparse-group LASSO demonstrated better performance compared to alternative methods, indicating the utility of incorporating text data alongside conventional numerical data.
The OECD recently addressed the timeliness issue associated with Trade in Value Added (TiVA) indicators, crucial for monitoring countries' integration into global supply chains. Typically published with significant lags, these indicators lose relevance in tracking recent economic shifts. The study focused on nowcasting five TiVA indicators for 2021 and 2022 across a panel of 41 economies and 24 industry sectors. It employs various models, including Gradient Boosted Trees (GBM) and other machine-learning techniques, within a panel framework.
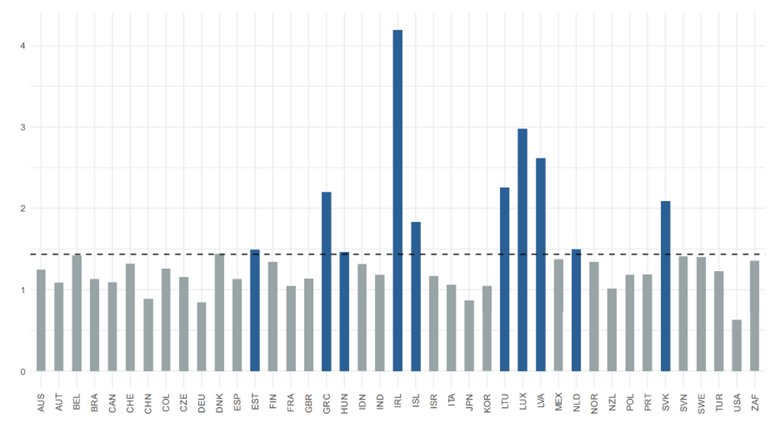
However, model performance measured by root-mean-square error (RMSE) was rather varied across the countries. Figure 4 above shows that largest economies had absolute RMSEs on average at 0.6 to 0.9 percentage point lower than the average of countries. Ireland stands out with the worst model performance, influenced by two interlinked factors. Firstly, its target volatility surpasses other countries, reflected in significantly higher standard errors in domestic value-added shares of exports compared to the group average. Secondly, Ireland experienced substantial transformations in its global value chains, notably reducing domestic value-added shares in information technology and informational services from 80% in 1995 to just 30% in 2020.
Andreini et al. (2023) developed a nowcasting model for the German economy and found that incorporating a foreign factor enhanced the model's accuracy, while the inclusion of financial variables did not contribute significantly. Additionally, the paper introduced a "news" index for the German economy, constructed as a weighted average of nowcast errors related to each variable in the model.
Ceci and Silvestrini (2023) found that nowcasts derived from probit models, based on a broad set of financial variables, generally outperform those from standard probit models relying on a single financial measure like the yield curve slope. Additionally, the proposed approach competes favorably even against probit models using single time series of real economic activity indicators such as industrial production, business surveys, or composite PMI indicators.
When traditional macroeconomic indicators are unreliable — whether due to delays in reporting, insufficient statistical capacity, political interference, or simply eroding trust among investors — market participants are increasingly forced to look elsewhere for signals about the health of the economy. This is where alternative data can provide valuable insights, filling in the gaps left by conventional datasets.
Alternative Data for CPI
Alternative data sources can be used to construct proxies for the CPI basket. By aggregating rental listings, retail scanner data, or online price trackers, asset managers can approximate the components of “core CPI” in near real-time. While this requires complex modeling and access to large, diverse datasets, some funds may instead turn to specialized macroeconomic data vendors who combine public and non-public sources to model inflation and other GDP-related metrics.
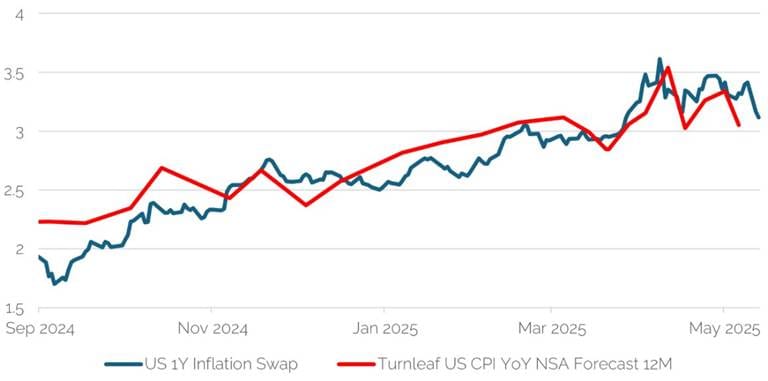
One such provider is Turnleaf Analytics, which gained attention for its CPI models. In recent years, one of the most widely followed economic releases has been US CPI. It has had a significant impact across a plethora of macro assets, as the market seeks to reprice assets in anticipation of the Fed’s future monetary policy. For there to be a relationship between inflation expectations and monetary policy expectations, a central bank needs to be perceived as credible when it comes to maintaining their inflation target.
If the market does not perceive a central bank as credible, then there is likely to be a breakdown between inflation expectations and monetary policy expectations. If this happens, a central bank may not hike rates, even with very high levels of inflation. Notably, as inflation expectations rise, we would expect yields to rise reflecting expectations for more hawkish policy. Conversely, falling inflation expectations would likely see falling yields to reprice more dovish expectations.
Turnleaf Analytics uses several types of data to nowcast US CPI: 1) Macroeconomic data on unemployment and growth; 2) Market data on FX rates and commodities; 3) Benchmark/consensus inflation forecasts; and 4) Time series on pollution which can be used as a proxy for industrial activity. The data is collected, pre-processed, and then fed into a machine learning model. Turnleaf’s analysis, using high-frequency trade and firm behavior data, suggests that while lower tariffs may slightly ease inflation, persistent uncertainty—especially beyond 90 days—continues to elevate long-term inflation expectations.
ClearMacro
ClearMacro provides a signal database to clients who want to build rules-based strategies and/or predictive macro models which can augment human judgement in discretionary investment processes. As a former institutional investor, the company’s starting point is the investment hypothesis/question and relevant data sources are then pulled to inform those questions.
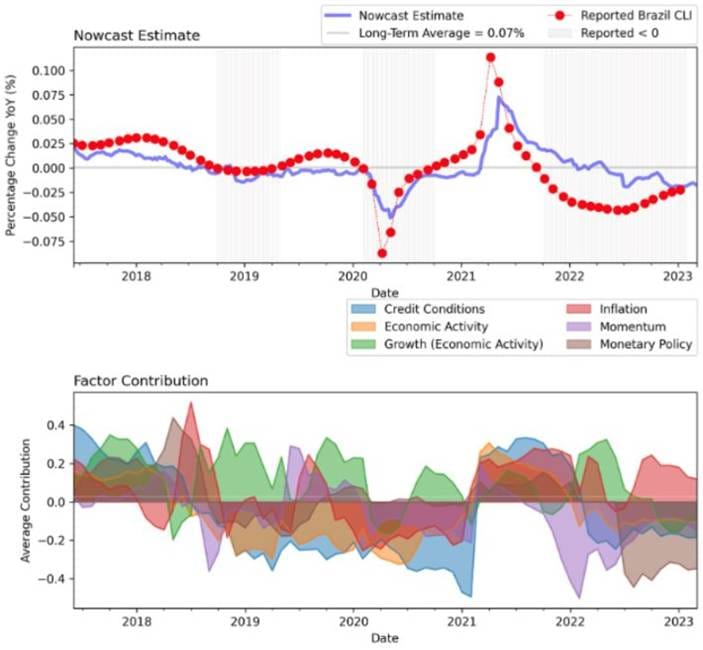
ClearMacro delivers several datasets, including composite signal data, return forecasting database, and nowcast databases covering GDP, CPI, and lead indicator nowcasts for 30 countries. Figure 6 below shows the results of nowcasts for Brazil.
Alternative Data for Non-Farm Payrolls
Alternative data has become an essential tool for anticipating the U.S. non-farm payrolls (NFP) report, one of the most market-sensitive economic releases. Since the Bureau of Labor Statistics publishes the data only once a month, investors and hedge funds seek earlier signals through non-traditional datasets. Private payroll processors such as ADP, workforce management systems like Kronos/UKG, and recruiting platforms including Indeed and LinkedIn provide near real-time views of hiring and labor demand that often foreshadow the official release.
LinkUp
LinkUp provides a job listing dataset that is sourced directly from employer websites, ensuring a high level of accuracy and authenticity. LinkUp’s job listing data is highly correlated to various job-centric macroeconomic indicators and is very predictive of overall trends in the labor market.
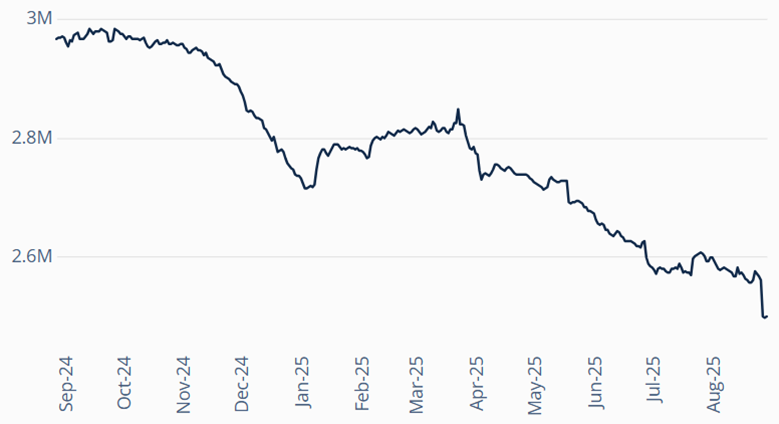
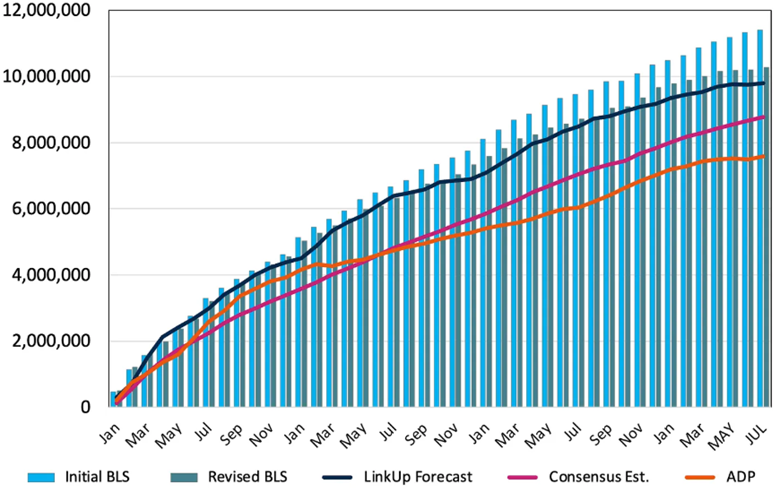
Figure 8 shows LinkUp 10,000, an analytic tracking job openings from the 10,000 companies with the most U.S. listings on LinkUp’s job search engine. Designed as a macroeconomic indicator, it reflects real-time changes in labor demand and serves as a predictive signal for future job growth. The daily version uses a 7-day lag to ensure data accuracy, while the monthly version aggregates unique job listings from the prior month without a lag.
The July jobs report highlighted a deepening problem with BLS data revisions, raising doubts about the reliability of initial releases. May and June payrolls were revised down by a combined 258,000 jobs, slashing average monthly job growth to just 85,000 this year and 35,000 since April. The gap between first estimates and final revisions has widened significantly, with the 2025 delta jumping from 21% to 47%, effectively making initial BLS reports an unreliable measure of labor market conditions.
This pattern of downward revisions has become more pronounced, leaving investors and economists increasingly reliant on alternative data sources for real-time insights into job trends. LinkUp’s data showed declines in labor demand not captured by official releases, further underscoring the growing disconnect between BLS initial prints and labor market reality.
Lightcast
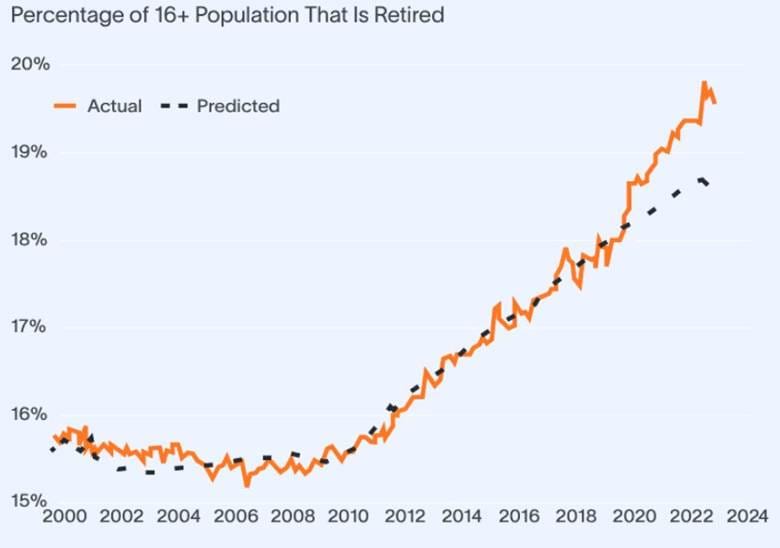
Lightcast provides comprehensive labor market analytics based on over 350 million job postings collected daily from 60,000+ global sources since 2010. Their recent report warns of an impending labor shortage driven by the mass retirement of Baby Boomers and a declining supply of younger workers. This demographic shift, already disrupting the workforce, will lead to a shortfall of over 6 million workers by the end of the decade.
The report explores how past labor dynamics shaped today’s market, highlights the mismatch between education levels and job needs, and outlines urgent strategies— including workforce development, automation, globalization, and immigration—to build a future-ready workforce. Without preparation, critical industries like healthcare and food service face severe labor shortages.
Conclusion
The erosion of trust in official government statistics, particularly from the Bureau of Labor Statistics, highlights the risks posed when data collection faces political interference, funding cuts, and falling response rates. Larger and more frequent revisions to core reports like CPI and NFP weaken the credibility of the numbers that policymakers, investors, and households depend on. With trillions of dollars in markets tied to these indicators, the stakes are high: even small doubts about accuracy or neutrality can ripple across Treasury markets, monetary policy expectations, and investor confidence.
In this environment, alternative data has emerged as a critical complement to traditional sources. From web-scraped prices used to proxy inflation to job listing datasets that anticipate payroll reports, these tools offer timelier and often more transparent signals about the economy’s direction. While not a substitute for robust public statistics, alternative data provides investors and policymakers with valuable safeguards against information gaps and credibility risks. Going forward, the balance between official statistics and innovative private datasets may shape how markets interpret—and trust—macroeconomic signals in an era of heightened uncertainty.